Web Conversion Optimization Strategies That Drive Results
Web Conversion Optimization Strategies That Drive Results
TL;DR:
- Most businesses lose revenue because their websites silently turn visitors away, not because of ad failures. Web conversion optimization fixes these issues by improving speed, UX, and testing strategies to increase goal completions. Continuous iteration and data-driven decisions are essential to sustain long-term conversion gains.
Most businesses lose revenue not because their ads fail or their product is wrong, but because their website quietly turns visitors away. Web conversion optimization is the practice of fixing exactly that. Research shows that a one-second delay in page load can cut conversions by 7%, and that single fact should reframe how you prioritize your marketing budget. This article breaks down the precise tactics, from funnel diagnostics to UX design for conversions, that give you control over what happens after the click.
Table of Contents
- Key takeaways
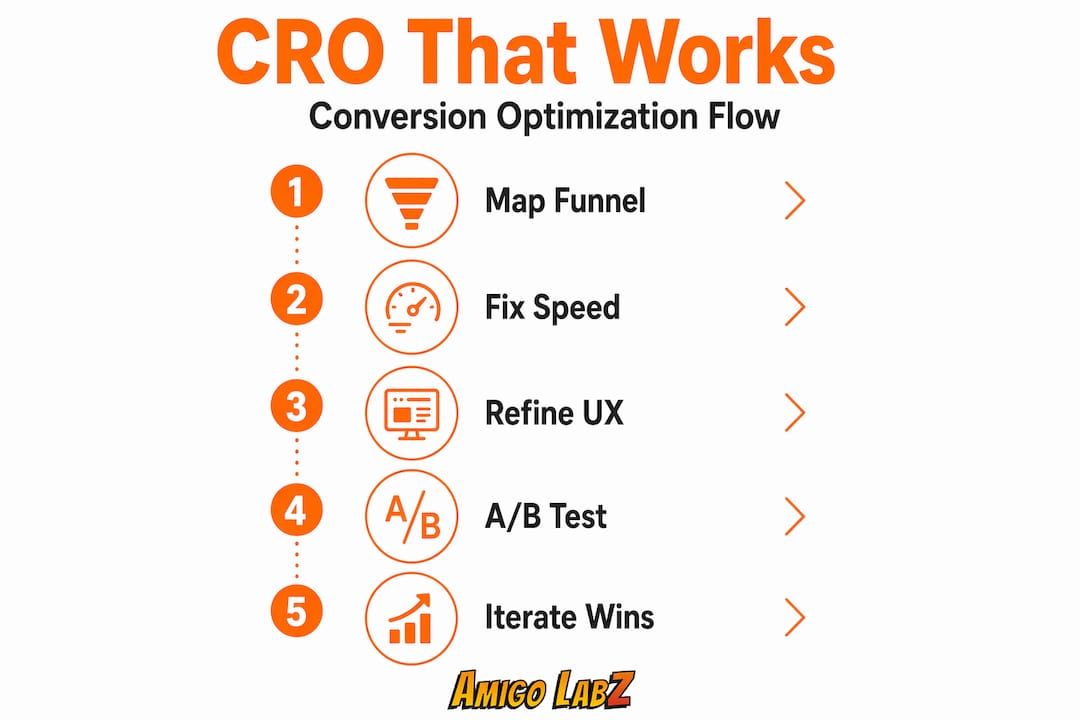
- Understanding your conversion funnel
- Site speed and Core Web Vitals
- UX design principles that reduce friction
- A/B testing to validate your improvements
- Sustaining gains through continuous iteration
- My perspective on what actually moves the needle
- How Amigolabz can accelerate your results
- FAQ
Key takeaways
| Point | Details |
|---|---|
| Speed kills conversions silently | Even a one-second page load delay reduces conversion rates by approximately 7%. |
| Funnel data beats guesswork | Use GA4 funnel reports to identify where real users drop off before investing in fixes. |
| UX trust signals matter | Security badges, plain language, and clear privacy disclosures measurably reduce friction. |
| A/B testing proves causation | Heatmaps reveal where users struggle; controlled A/B tests confirm whether your fix actually works. |
| Iteration compounds gains | Treating CRO as a continuous cycle, not a one-time project, produces the largest long-term ROI. |
Understanding your conversion funnel
Before you change a single button color or rewrite a headline, you need to know where users are actually leaving. That sounds obvious, but most teams skip this step and spend months optimizing pages that were never the real problem.
A conversion funnel maps the steps a user takes from first landing on your site to completing a goal, whether that is a purchase, a form submission, or a phone call. The power is in seeing where the drop-offs happen. GA4 funnel analysis lets you visualize those drop-off points and even shows you how much time users spend between each step, which tells you whether friction is about confusion, load speed, or hesitation.
Here is how to use that data productively:
- Map steps to real user actions. Your funnel model needs to reflect what users actually do, not what you want them to do. Analytics event models must mirror true journey steps to avoid misleading test results.
- Segment by device and source. A drop-off that looks minor in aggregate might be catastrophic on mobile. Segmenting reveals where to focus first.
- Prioritize by leakage volume. Fixing the funnel stage with the highest user drop-off delivers better ROI than polishing a high-traffic page that was already converting well.
- Check revenue impact, not just drop-off rate. A 20% drop-off on a $10 product matters far less than a 5% drop-off on a $500 service.
Pro Tip: Set up GA4 funnel exploration reports filtered by your top three traffic sources. Users from paid search often abandon at different stages than organic visitors, and combining them into one view hides the real problem.
The data from behavioral analytics reinforces this approach. When you know which step costs you the most customers, every other optimization decision becomes faster and cheaper to make.
Site speed and Core Web Vitals
Load time is not a technical problem. It is a revenue problem. Google's Core Web Vitals give you three measurable thresholds that directly correlate with whether users stay or leave: LCP under 2.5 seconds, CLS under 0.1, and INP under 200 milliseconds. Miss any one of these and you are losing conversions you cannot see in your ad reports.
Here is what each metric means in practice:
| Metric | What it measures | Target threshold | CRO impact |
|---|---|---|---|
| LCP (Largest Contentful Paint) | How fast the main content loads | Under 2.5 seconds | Directly tied to bounce rate |
| CLS (Cumulative Layout Shift) | How much the page jumps around while loading | Under 0.1 | Causes accidental clicks and rage clicks |
| INP (Interaction to Next Paint) | How fast the page responds to user input | Under 200ms | Affects form completion and checkout |
The tactics that move these numbers are well established. Compress and convert images to modern formats like WebP. Defer non-critical JavaScript so your main content loads first. Use a content delivery network to serve assets from servers geographically close to your users. Implement lazy loading so below-the-fold content does not block above-the-fold rendering.
What most teams get wrong is treating these as a one-time audit. Performance-driven CRO efforts should be treated as ongoing experiments, validated by controlled measurement, not assumed to be solved after a single sprint. A page that scores well in December can regress in March after a plugin update or new image-heavy campaign.
Pro Tip: Run Google PageSpeed Insights on your top five highest-traffic landing pages every time you launch a new campaign. Performance regressions often come from new creative assets, not code changes.
Reducing load and response times improves both SEO and conversion rates simultaneously, which makes website performance enhancement one of the highest-leverage activities in any marketing budget.
UX design principles that reduce friction
Speed gets users to your page. Design keeps them there and moves them forward. Good UX design for conversions is not about aesthetics. It is about removing the mental effort required to take the next step.

The most effective principle is clear visual hierarchy. Your page should answer three questions in under five seconds: what is this, why should I care, and what do I do next. When those answers require scrolling, reading dense paragraphs, or decoding industry jargon, users leave.
Here are the friction points worth attacking first:
- Form length. Every additional field you add to a form reduces completions. If your inquiry form asks for a phone number, a company name, an annual budget, and a timeline before the user has any reason to trust you, you will lose them. Start with just name and email.
- Trust signals. Security badges, privacy statements, and compliance disclosures measurably reduce perceived risk, especially in regulated industries like finance, legal, and healthcare. Place them near your CTA, not buried in the footer.
- Accessibility. Contrast ratios, keyboard navigation, and screen reader compatibility are not just legal considerations. They are conversion levers. A form that a visually impaired user cannot complete is a lost customer.
- Progress indicators. For multi-step flows, showing users where they are in the process reduces abandonment. People are more likely to finish something when they can see the finish line.
Plain language deserves its own emphasis. Writing at a 10th-grade reading level is not dumbing things down. It is removing the processing delay that happens when users encounter words they have to decode. Shorter sentences, active verbs, and concrete benefits convert better than passive, abstract marketing copy every time. You can find frameworks for building authority alongside simplicity in Amigolabz's guide to proven conversion strategies.
A/B testing to validate your improvements
Here is the problem with most conversion rate fixes: you implement them, traffic numbers shift slightly, and you assume the change worked. That is not evidence. That is a coincidence mistaken for causation. Proper A/B testing for websites is how you separate the two.
A proper A/B test splits your traffic randomly between a control version (what exists today) and a variant (your proposed change). Both versions run simultaneously for a statistically significant period, and you measure a primary outcome like form completions or checkout rates, not vanity metrics like time on page.
Follow these steps to run tests that produce reliable results:
- Identify the highest-leakage funnel step first. Testing a homepage headline when your checkout abandonment rate is 70% is the wrong priority. Always start where the pain is biggest.
- Change one variable at a time. Testing a new headline and a new image simultaneously makes it impossible to know which change produced the result.
- Set your success metric before launching. Post-hoc metric selection leads to false positives. Decide upfront what a win looks like.
- Run the test long enough. Do not stop a test early because it looks like it is winning. Natural traffic fluctuations will mislead you.
- Partition experiments correctly. Multiple tests cannot run on the same user flow without proper traffic partitioning, or the results from both tests become invalid.
Heatmaps and session recordings tell you where users are struggling. A/B tests tell you whether your fix actually solved the problem. Both tools are necessary. Using only one is like diagnosing a problem without treating it, or treating it without ever confirming the diagnosis.
Pro Tip: Use heatmap data specifically to generate your A/B test hypotheses. If users consistently ignore your CTA button but click on a product image nearby, test moving the CTA next to that image rather than just changing its color.
For a deeper look at how behavioral analytics tools fit into this diagnostic process, the Amigolabz blog covers the mechanics of heatmap interpretation in practical detail.
Sustaining gains through continuous iteration
Getting a conversion rate win feels great. Losing it three months later because you stopped paying attention is the more common outcome. Sustained customer journey optimization requires building a repeatable process, not just running occasional tests.
The foundation is a living backlog of optimization opportunities ranked by potential impact and effort. You populate that backlog from:
- Funnel analytics showing where drop-offs increased or new friction appeared
- Heatmap and session recording reviews run on a monthly cadence
- Qualitative data from customer support tickets and sales call notes
- Technical audits checking for performance regressions after new deployments
Cross-channel alignment matters more than most teams realize. If your paid social ad promises a 20% discount but your landing page leads with a product category instead of that offer, you are creating a mismatch that breaks the user's mental model. The conversion path starts at the first touchpoint, not the landing page.
The businesses that compound CRO gains year over year are not the ones who run the most tests. They are the ones who maintain clean data, monitor regressions, and treat every site change as something that could break what is already working.
Building this process also means assigning ownership. Someone on your team needs to be responsible for checking Core Web Vitals scores after every major deployment, reviewing GA4 funnel data on a weekly basis, and pulling heatmaps after each new campaign. Without ownership, even the best tools produce no results.
My perspective on what actually moves the needle
I have seen businesses spend serious money on paid ads, creative redesigns, and new platforms without ever fixing the actual problem. The traffic was fine. The offer was fine. The page was just slow, confusing, or asking for too much, too soon.
What I have learned from working through real optimization projects is that most teams focus on top-of-funnel improvements because they are visible and feel strategic. Changing an ad headline is something you can show in a presentation. Fixing your checkout page's LCP score or removing three form fields is harder to dramatize, but it is where the real money is.
I also think people underestimate how much bad event tracking costs them. If your GA4 events are not accurately reflecting the steps users take, your funnel reports are fiction. You will optimize the wrong things with confidence, which is worse than not optimizing at all.
My take: treat your website like a live experiment, not a finished product. Every change is a hypothesis. Every deploy is a test. The teams that adopt this mindset stop arguing about opinions and start letting data settle disagreements. Small, validated wins compound faster than anyone expects when you run them consistently over 12 to 18 months.
— John
How Amigolabz can accelerate your results
If this process sounds like it requires dedicated expertise, that is because it does. At Amigolabz, we work directly with business owners and marketing teams to build CRO programs that connect analytics, UX improvements, and paid traffic into one coordinated strategy.

Whether you need a sharper Google Ads strategy that sends qualified traffic to properly optimized pages, a Facebook Ads campaign built around a tested funnel, or SEO services that bring in visitors ready to convert, we handle the execution while you stay focused on running your business. Our teams in New Jersey and Nevada have helped businesses across the country turn traffic into revenue through patient, data-driven work. Book a call to talk through where your funnel is leaking and what fixing it would be worth.
FAQ
What is web conversion optimization?
Web conversion optimization is the process of improving your website so a higher percentage of visitors complete a desired action, such as buying, signing up, or calling. It combines analytics, UX improvements, and controlled testing to produce measurable results.
How much does page speed affect conversion rates?
Research shows that a one-second delay in page load time reduces conversions by approximately 7%. Faster sites consistently outperform slower ones across industries.
Where should I start with A/B testing?
Start at the funnel step with the highest user drop-off rate, not the page with the most traffic. Fixing where users leave most frequently produces the fastest measurable gains.
How do heatmaps improve conversion rates?
Heatmaps identify where users hesitate, scroll past important content, or ignore CTAs. That behavioral data feeds directly into targeted A/B test hypotheses that are far more likely to win.
How long does it take to see conversion optimization results?
Small wins from speed and UX fixes can appear within weeks. Statistically valid A/B test results typically require two to four weeks of consistent traffic. Compounding gains from a sustained program generally become significant over six to twelve months.
Recommended