Data analytics: 25% efficiency gains for your business
Data analytics: 25% efficiency gains for your business

TL;DR:
- Data analytics transforms raw business data into actionable decisions, improving efficiency and reducing costs.
- Small businesses can benefit from analytics through better marketing targeting and operational improvements.
- Focused KPIs and a clear analytics process help avoid analysis paralysis and drive smarter business choices.
Most business owners in New Jersey and Nevada assume data analytics belongs to the Fortune 500 crowd, the companies with dedicated data science teams and million-dollar software budgets. That assumption is costing you real money. Case studies show 25% efficiency gains and 30% cost reductions for businesses that embrace analytics, regardless of size or industry. This guide breaks down what analytics actually means in plain terms, how it applies to marketing and operations, and what steps you can take right now to start seeing results, whether you run a retail shop in Newark or a service company in Las Vegas.
Table of Contents
- What is data analytics and why does it matter?
- Core methodologies and the analytics process
- How data analytics boosts marketing strategies
- Driving operational efficiency with actionable insights
- Why the right data is more important than more data
- Ready to make analytics work for your business?
- Frequently asked questions
Key Takeaways
| Point | Details |
|---|---|
| Measurable efficiency gains | Data analytics can increase business efficiency by 25% and reduce costs by 30%. |
| Simple tools to start | Platforms like Google Analytics and Looker Studio offer an easy entry point for SMBs. |
| Focus on actionable data | Tracking the right KPIs matters more than collecting large amounts of information. |
| Analytics-driven marketing | Data analytics enables smarter marketing decisions that drive revenue growth. |
What is data analytics and why does it matter?
Data analytics is the process of collecting raw information about your business, your customers, your marketing campaigns, and your operations, and then turning that information into decisions you can act on. It is not about building complex algorithms or hiring a team of PhDs. It is about replacing gut feelings with facts.
There are four core types of analytics, and each one answers a different question:
- Descriptive analytics: What happened? (Your sales dropped 15% last month.)
- Diagnostic analytics: Why did it happen? (A competitor ran a promotion that pulled customers away.)
- Predictive analytics: What will likely happen? (Based on seasonal patterns, expect a 20% sales spike in October.)
- Prescriptive analytics: What should you do about it? (Increase your ad budget by 10% in September to capture early demand.)
For marketing strategy, analytics tells you which campaigns are actually driving revenue versus which ones just look busy. For operations, analytics identifies bottlenecks, optimizes inventory levels, and improves how you allocate staff and resources. These are real, measurable improvements, not theoretical concepts.
Think about the blind spots most businesses carry around every day. You might be spending $2,000 a month on a marketing channel that brings in customers who never buy again, while ignoring another channel that quietly delivers your most loyal clients. Analytics surfaces those patterns so you can shift your effort where it counts.
"The businesses that grow fastest are not the ones with the most data. They are the ones who understand what their data is telling them and act on it fast."
If you are curious about what website solutions can help you collect and interpret the right data for your specific business model, that is a great starting point for New Jersey and Nevada owners ready to make smarter decisions.
Core methodologies and the analytics process
Understanding the types of analytics is useful, but what matters more is knowing the actual process for moving from scattered data to clear action. Here is a straightforward workflow most businesses can follow:
- Collect the data. Pull information from your website, point of sale system, email platform, social media, and ad accounts. You do not need everything at once.
- Clean and organize it. Remove duplicates, fix inconsistencies, and group data into meaningful categories.
- Analyze the patterns. Look for trends, spikes, drops, and correlations. Ask "why" whenever something looks unusual.
- Test your assumptions. Run A/B tests on your ad campaigns or product pages to see what actually performs better, not what you think will perform better.
- Act on the findings. Make a concrete change based on what the data shows.
- Monitor the results. Track whether your change improved the metric you targeted.
Here is a quick comparison of the four analytics types to keep the framework clear:
| Analytics type | Question answered | Example use |
|---|---|---|
| Descriptive | What happened? | Monthly revenue report |
| Diagnostic | Why did it happen? | Identifying a traffic drop source |
| Predictive | What will happen? | Forecasting seasonal demand |
| Prescriptive | What should I do? | Recommending budget shifts |
These four analytics types form a complete decision-making framework when used together. Most small businesses only use descriptive analytics because that is what basic reports provide. Moving into diagnostic and predictive territory is where the real competitive edge shows up.
For example, using Google Ads data alongside SEO analytics lets you see which keywords drive conversions versus which ones only drive clicks, a distinction that can save thousands in wasted ad spend.

Pro Tip: Start with a single KPI like conversion rate before layering in more metrics. One well-tracked number will teach you more than ten poorly understood ones.
How data analytics boosts marketing strategies
Marketing without analytics is like driving at night with your headlights off. You might reach your destination, but the odds are not in your favor. Analytics-driven marketing lets you see exactly where your customers come from, what moves them to buy, and where they drop off before converting.
Here is what changes when you bring analytics into your marketing workflow:
- You stop guessing which ad creatives work and start testing them with real data.
- You identify your highest-value customer segments and focus budget there.
- You spot the exact point where people abandon your website or landing page.
- You track campaign ROI down to the dollar, not just clicks and impressions.
Two tools every NJ and NV business owner should know are Google Analytics and Looker Studio. These tools are accessible to small and mid-sized businesses and require no advanced technical background to get started. Google Analytics shows you what happens on your website. Looker Studio turns that raw data into visual dashboards you can actually read and share with your team.
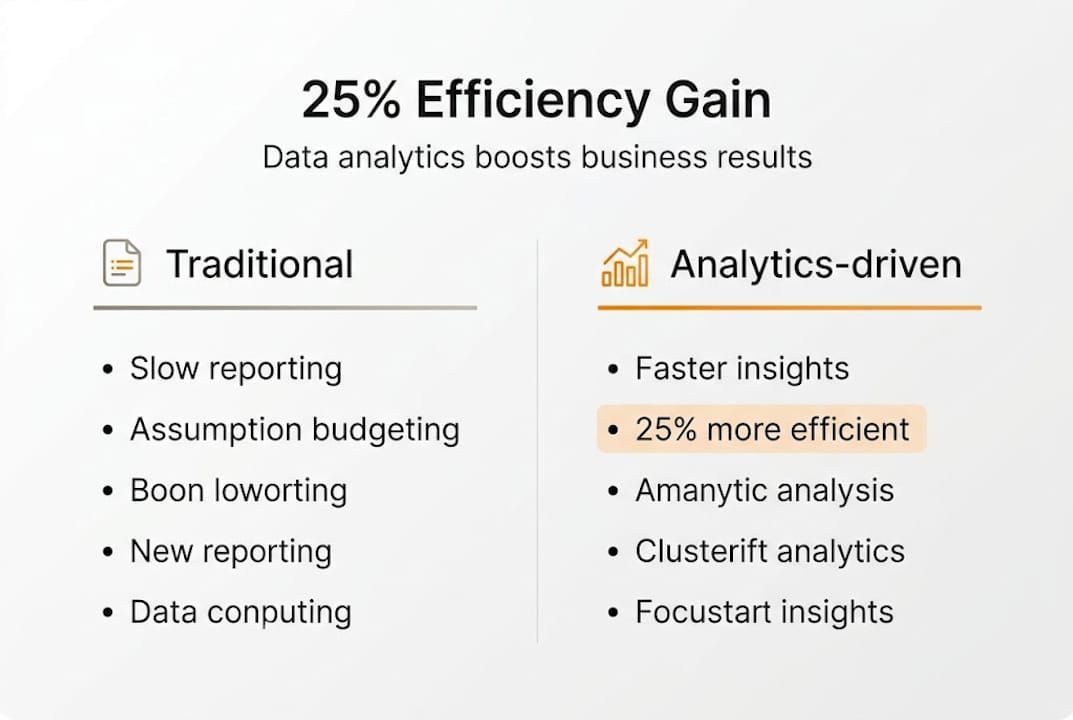
| Traditional marketing | Analytics-driven marketing |
|---|---|
| Budget based on assumptions | Budget based on performance data |
| Same message for all audiences | Personalized messages by segment |
| Measure success by reach | Measure success by revenue impact |
| Adjust campaigns quarterly | Adjust campaigns in real time |
The difference in outcomes is significant. Businesses that adopt analytics-driven approaches consistently report up to 25% higher efficiency in their marketing operations. That is not a marginal improvement. For a business spending $5,000 per month on ads, 25% efficiency means $1,250 more value from the same budget.
If you are already running paid social campaigns, tracking Facebook Ads performance through analytics will show you which audiences, placements, and ad formats are actually driving sales, so you can double down on what works.
Driving operational efficiency with actionable insights
Improving marketing is just the start. Data analytics also delivers measurable gains on the operational side of your business, and for many owners, this is where the biggest savings hide.
Analytics finds inefficiency fast. Here is how a practical operational improvement process looks:
- Collect operational data. Track order fulfillment times, staff hours by task, inventory turnover, and customer wait times.
- Analyze for patterns. Look for recurring slowdowns, high-cost periods, or processes that take longer than they should.
- Identify the root cause. Use diagnostic analytics to figure out why an inefficiency exists, not just that it exists.
- Take targeted action. Make one specific change and measure the impact before making another.
- Monitor continuously. Operational data changes constantly. Weekly or monthly reviews keep you ahead of problems.
Pro Tip: Pay attention to outliers in your data. A sudden spike in product returns or a day with unusually low output often signals a hidden process problem that regular averages will mask.
"A retailer in New Jersey who began reviewing daily sales data found they were overstocking three product lines every quarter. Cutting that overstock reduced their carrying costs by nearly 30% within six months."
That kind of result is not unique. Real case studies show 30% cost reductions when businesses apply data-driven resource allocation consistently. Staff scheduling, inventory purchasing, and supplier negotiations all become sharper decisions when backed by actual numbers.
For businesses ready to connect operational analytics with broader digital business solutions, integrating your sales, marketing, and operations data into one view is the next step toward serious efficiency gains.
Why the right data is more important than more data
Here is the uncomfortable reality most analytics articles skip over. Businesses that collect the most data do not automatically win. In fact, too much data often leads to slower decisions and zero action. This is called the analytics paradox, and it is a real trap.
The analytics paradox shows that good data still produces bad decisions when your team does not have a clear culture of acting on findings. You can have every metric imaginable in a dashboard and still make choices based on personal preference or fear of change.
For small and mid-sized businesses in New Jersey and Nevada, the better approach is narrow and focused. Pick three to five KPIs that directly connect to revenue or efficiency. Master those. Build habits around reviewing them weekly. Then expand once those habits are locked in.
Edge cases matter here too. A single week where a product sold unusually well in one zip code might reveal a customer segment nobody had identified. That kind of insight only appears when someone is actually looking at the data with a question in mind, not just generating reports to feel productive. Visit Amigo Labz to learn how NJ and NV business owners can build focused analytics habits that lead to real decisions.
Ready to make analytics work for your business?
Understanding analytics is one thing. Putting it to work inside your specific business is another challenge entirely, and that is exactly where we come in.

At Amigo Labz, we work directly with business owners across New Jersey and Nevada to build marketing and analytics strategies that fit your goals, your budget, and your industry. Whether you want to improve campaign performance through Google Ads solutions, scale your reach with Facebook Ads services, or just figure out where to start, we build the strategy around your real numbers. The best next step is a conversation. Book a strategy call and let us show you exactly what your data is telling you.
Frequently asked questions
What is the difference between descriptive, predictive, and prescriptive analytics?
Descriptive shows what happened, predictive forecasts what will happen based on trends, and prescriptive recommends the specific action you should take next. Together they create a complete decision-making loop.
Do small businesses really benefit from data analytics?
Absolutely. Even basic analytics practices can lead to 25% efficiency gains and 30% lower costs, results that show up in businesses of every size and industry.
Which analytics tools are best for marketing strategies?
Google Analytics and Looker Studio are the ideal starting tools for most small businesses in New Jersey and Nevada because they are free, powerful, and built for non-technical users.
How do I avoid analysis paralysis with business data?
Focus on three to five actionable KPIs tied to revenue rather than tracking every available metric. Fewer, better metrics create faster and more confident decisions.
Recommended
- Website Design | Amigo Labz | New Jersey & Nevada
- Tailored Website Solutions | New Jersey & USA
- Google Ads | New Jersey & USA
- Website Design | Amigo Labz | New Jersey & USA
- Maximizing Efficiency: How Workflow Automation Transforms Businesses - Toptest Global | QA-Driven IT & Workflow Automation Solutions