What Is a Heatmap? Visualizing User Behavior for Better Marketing
What Is a Heatmap? Visualizing User Behavior for Better Marketing

TL;DR:
- Heatmaps visualize user interactions, revealing the "why" behind website behavior.
- Different heatmaps track clicks, scrolls, attention, or mouse movements for targeted insights.
- Regular analysis and iterative testing with heatmaps improve website conversions and user experience.
Your website analytics dashboard tells you how many people visited, how long they stayed, and which pages they bounced from. What it does not tell you is why. Why did visitors ignore your call-to-action button? Why did they stop scrolling halfway through your landing page? Numbers can not answer those questions. Heatmaps can. These visual tools overlay real user behavior directly onto your web pages, turning raw interaction data into something you can actually see and act on. If you are a digital marketer or business owner serious about improving conversions, this guide breaks down what heatmaps are, how they work, and why they belong in your strategy.
Table of Contents
- What is a heatmap? The basics explained
- The different types of website heatmaps
- Why heatmaps matter for user experience and marketing
- How to use heatmaps in your marketing strategy
- Our unique perspective: Heatmaps beyond the basics
- Take your marketing to the next level with expert help
- Frequently asked questions
Key Takeaways
| Point | Details |
|---|---|
| Heatmaps visualize behavior | Heatmaps use color gradients to show where site visitors click, scroll, or move on your pages. |
| Multiple heatmap types | Click, scroll, and attention heatmaps each provide different insights for marketers and web owners. |
| Boosts ROI and usability | Heatmaps uncover hidden user patterns that help increase conversions and improve site experience. |
| Data-driven strategy | Effective marketers use heatmap insights to test, optimize, and strategize smarter changes. |
What is a heatmap? The basics explained
With the need for more visual user data clear, let us break down exactly what heatmaps are and how they work.
A heatmap in digital analytics is a data visualization layer placed over a webpage, showing where users click, scroll, or hover. Instead of reading a column of numbers, you see a color-coded image of your actual page. Heatmaps are visual tools that illustrate how users interact with a webpage by using graded colors to represent activity. Red and orange signal high engagement. Blue and green show low or no activity. This color language makes patterns instantly obvious, even to someone who has never looked at a data report before.
Think of it like a weather radar map. High-pressure zones are bright red. Calm zones are cool blue. You immediately know where the action is without reading a single data point.
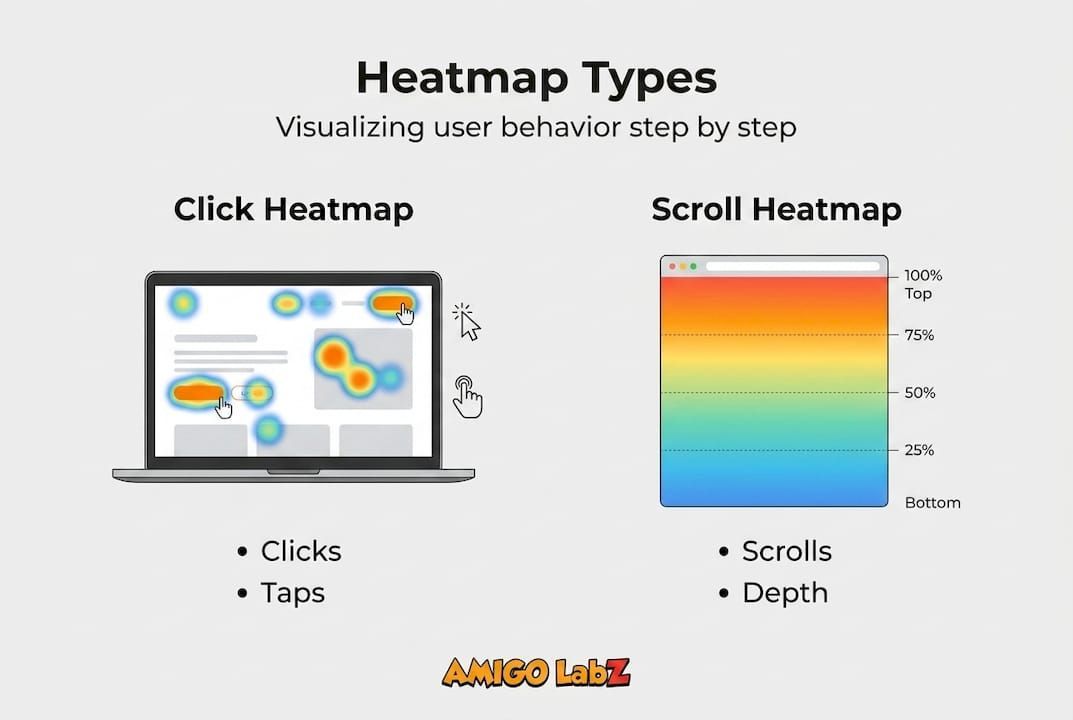
Here is a quick look at the most common heatmap types you will encounter:
- Click heatmaps: Show exactly where users click on a page, including spots that are not even clickable links.
- Scroll heatmaps: Reveal how far down the page users actually scroll before leaving.
- Attention heatmaps: Combine hover and scroll data to estimate where users spend the most focused time.
- Mouse movement heatmaps: Track cursor paths across the screen, which often correlate with where users are reading.
Heatmaps vs. traditional analytics at a glance:
| Feature | Traditional Analytics | Heatmaps |
|---|---|---|
| Data format | Numbers and percentages | Visual color overlays |
| Shows user intent | No | Yes |
| Identifies ignored content | No | Yes |
| Reveals rage clicks | No | Yes |
| Requires data interpretation | Heavy | Minimal |
| Best for | Traffic and volume trends | UX and behavior patterns |
The table above makes the difference clear. Traditional analytics tell you what happened. Heatmaps show you how it happened.
Pro Tip: Do not pick a heatmap type at random. Match the tool to your specific question. Trying to figure out if users see your pricing section? Use a scroll map. Wondering why your CTA button gets ignored? A click map is your answer.
The different types of website heatmaps
Now that you know what a heatmap is, let us get specific about the main types you will encounter and how each can fuel your strategy.
Different heatmaps provide different user insights , from identifying where visitors click to how far they scroll. Each type is built for a different marketing question, and using the wrong one wastes time.

Heatmap types compared:
| Heatmap type | What it tracks | Best marketing use |
|---|---|---|
| Click heatmap | Clicks and taps on any page element | CTA optimization, navigation testing |
| Scroll heatmap | How far users scroll before leaving | Content placement, page length decisions |
| Attention heatmap | Estimated reading time per section | Content layout, above-the-fold testing |
| Mouse movement heatmap | Cursor path and hover zones | Form UX, visual flow analysis |
Here is a practical example for each. A click heatmap might show that users are clicking on a product image expecting it to be a link, but nothing happens. That is a missed conversion opportunity you can fix today. A scroll heatmap might reveal that 70% of visitors never reach your testimonials section, which means you should move social proof higher on the page. An attention heatmap could show that your hero headline barely gets read because a distracting visual pulls eyes away from it.
Here is how to interpret click and scroll maps effectively:
- Load the heatmap overlay on your target page and let data collect for at least 500 sessions before drawing conclusions.
- Identify the hottest and coldest zones by scanning for red and orange clusters versus blue and empty areas.
- Check for rage clicks on non-clickable elements, which signal user frustration or confusion.
- Compare scroll depth against your key content placement to see if users actually reach your value propositions.
- Cross-reference with conversion data to determine if high-click areas align with business goals or distract from them.
This step-by-step read makes the data actionable rather than just pretty to look at.
Why heatmaps matter for user experience and marketing
Understanding the different types sets the stage for seeing why heatmaps are such a game-changer for your website and marketing efforts.
Heatmaps do not just satisfy curiosity about user behavior. They surface patterns that directly impact your bottom line. Every cold zone on a landing page is a clue about why conversions are underperforming. Every cluster of rage clicks points to friction that is quietly driving customers away.
"Using heatmaps can help identify roadblocks to conversion that analytics data alone can miss." — Optimizely
That insight is critical. A business owner staring at a 2.1% conversion rate in Google Analytics has no idea what to fix. A heatmap shows them exactly which element is failing.
Here is where heatmaps deliver the clearest marketing wins:
- Landing page optimization: See which headlines and CTAs attract attention and which get skipped entirely.
- Ad conversion improvement: For businesses running optimizing Google Ads campaigns , heatmaps reveal whether post-click behavior matches ad intent.
- Navigation clarity: Identify confusing menu elements or dead-end clicks that push users off the page.
- Above-the-fold content: Confirm that your most important value message sits where users actually look first.
The numbers back this up. A/B tested landing pages informed by heatmap insights consistently deliver higher conversion rates than pages changed based on gut instinct alone. Seeing real user paths before testing means you are making educated changes, not random guesses.
For digital marketers managing multiple campaigns, heatmaps also provide a unifying view across traffic sources. A visitor from a paid social ad may behave very differently than one arriving from organic search. Heatmaps by traffic segment reveal those differences, helping you tailor page experiences to each audience.
How to use heatmaps in your marketing strategy
With the benefits in mind, let us move to actionable steps for making heatmaps a core part of your marketing toolkit.
Getting started with heatmaps involves choosing the right tool, setting goals, and analyzing real user interactions. The process is more straightforward than most marketers expect.
Follow these steps to set up and use heatmaps effectively:
- Choose a heatmap tool that fits your budget and tech setup. Popular options include Hotjar, Crazy Egg, and Microsoft Clarity, which is free.
- Install the tracking code by adding a small JavaScript snippet to your website. Most tools walk you through this in minutes.
- Define your goal before data starts collecting. Are you trying to increase form completions? Improve scroll depth on a blog post? Clarity of purpose shapes how you read the data.
- Let data accumulate for a minimum of 500 to 1,000 sessions to avoid conclusions based on small sample sizes.
- Analyze patterns by looking for mismatches between where users engage and where you want them to engage.
- Make one change at a time so you can attribute results to a specific fix, then test again.
Pro Tip: Focus your initial heatmap analysis on your top five highest-traffic pages and your primary conversion paths. Spreading attention across dozens of pages dilutes your insights and slows results.
These are the most common mistakes to avoid when using heatmaps:
- Acting on too little data. One hundred sessions is not enough to spot meaningful patterns.
- Ignoring mobile behavior. Desktop and mobile heatmaps often look completely different. Always analyze both.
- Changing multiple elements at once. You will not know what moved the needle.
- Skipping context. A cold zone is only a problem if that section is supposed to convert. Check your goals first.
For deeper results, pair your heatmap findings with SEO heatmap integration to align content placement with search intent. If you run paid social, using heatmaps for Facebook Ads performance can reveal whether your ad audience engages with landing page content as expected. And if you want a full strategy built around these tools, explore full-service website optimization to see how everything connects.
Our unique perspective: Heatmaps beyond the basics
At Amigo Labz, we have worked with business owners across New Jersey and Nevada who came to us convinced that heatmaps alone would solve their conversion problems. Here is the honest truth: heatmaps are powerful, but they are not magic.
One insight that surprises almost every client is this: the cold zones are often more valuable than the hot spots. When an entire section of a page goes untouched, that is not just a missed opportunity. It is a signal about page structure, visual hierarchy, or messaging failure that no amount of A/B testing will fix without first understanding the root cause.
The bigger mistake we see is treating heatmap data as a one-time exercise. Businesses run a heatmap for a month, make a change, and never look again. Real improvement comes from a test-iterate-learn cycle that repeats continuously. User behavior shifts as your traffic sources, offers, and market change.
Heatmaps also work best when paired with qualitative feedback. A scroll map tells you users stopped at the pricing section. A user survey tells you why. Together, they give you a full picture. Exploring advanced local marketing strategies alongside your heatmap program can accelerate results by attracting better-fit visitors who are more likely to engage deeply.
Take your marketing to the next level with expert help
Knowing what heatmaps are is one thing. Turning that knowledge into actual revenue is another. At Amigo Labz, we help businesses go beyond the data and build strategies that convert.

Our team specializes in reading behavioral data, designing better user experiences, and connecting those improvements to your broader website solutions and SEO services. Whether you are just getting started with heatmaps or looking to optimize a full digital funnel, we bring creative thinking and real marketing experience to every project. Ready to stop guessing and start growing? Book a call with our team and let us show you what your website is really telling you.
Frequently asked questions
How do I set up a heatmap on my website?
Setting up a heatmap typically involves installing a snippet of code to track user activity. Choose your tool, drop the tracking script into your site, and visual reports start generating automatically once enough sessions are recorded.
Do heatmaps capture data from mobile users?
Modern heatmap tools offer mobile data tracking, but you should always confirm that your chosen tool specifically supports mobile views, since desktop and mobile heatmaps are displayed separately.
Which pages benefit most from heatmaps?
Heatmap analysis is most useful on pages tied directly to business goals like conversions. Homepages, landing pages, and checkout flows typically deliver the most actionable insights because user behavior on those pages has the highest revenue impact.
Are heatmaps GDPR and privacy-compliant?
Leading heatmap providers follow GDPR and privacy guidelines by anonymizing collected data, but you should always review and configure your tool's compliance settings based on your specific audience and operating region.
Recommended